AI-powered charts and data visualization — from data to insight in seconds. One API call turns raw data into a production-ready, AI-annotated chart image.
A chart-generation product on the CloviTek platform — server-side rendering, AI-annotated output, and permanent branded CDN URLs.
CloviCharts turns raw data into production-ready, AI-annotated chart images in one API call. It eliminates the need to bundle chart libraries across multiple services, standardizes visual styling across products, and automatically generates a one-sentence insight explaining what the data means — server-side, in under 400ms.
The chart-generation API space sits between heavy client-side libraries you have to bundle in every service, generic watermarked image APIs, and full BI platforms priced per seat. CloviCharts owns the middle — a developer-first rendering API with AI insight, aimed at teams who want production-ready charts without dragging a chart library into every product.
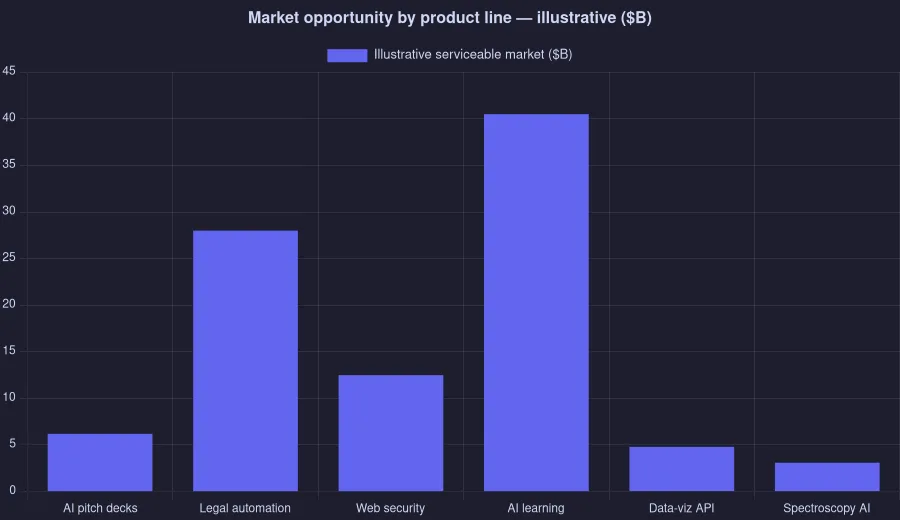
The business-intelligence market is large and growing, but the chart-generation API sub-segment is split between bundled libraries, watermarked image APIs, and overkill BI platforms. CloviCharts is built to capture the underserved developer middle.
Market sizes are third-party estimates. TAM/CAGR figures describe the addressable market, not a forecast of company results.
Most chart APIs stop at the image. CloviCharts appends a one-sentence AI insight to every chart, renders server-side so nothing needs bundling, and accepts batches — all through a single developer-first API that also takes no-code CSV uploads.
The real capability set behind CloviCharts — designed, built, and run by our composed AI team.
Bar, line, pie, donut, scatter, radar, polar, sparkline, funnel, bullet, slope, waterfall, and more. Phase 2 adds heatmap, sankey, gauge, and treemap through the same API.
PNG, WebP, SVG (Pro+), and Base64 inline. The free tier uses local disk with a 7-day expiry; paid tiers store on S3/CloudFront with permanent URLs.
Every feature is reachable via REST at the same tier as the UI — no UI-only features. Batch endpoints, webhooks, scheduled refreshes, and per-key rate-limit tiers.
Track charts generated per day, top chart types, AI-annotation adoption, and tier utilization — a dashboard that drives product-roadmap decisions.
Save named theme profiles with custom colors and fonts. Enterprise adds white-label CDN delivery, logo watermarking, and a dedicated rendering pool.
A one-sentence AI insight is available on every plan, with monthly annotation allowances that scale by tier and add-on packs for extra volume.
Define a chart once and set it to regenerate on a schedule via webhook — embedded dashboards stay current without manual re-running.
Up to five seats with a shared gallery, individual generate-only API keys, admin controls, and unified billing — no separate account per team member.
Drop a spreadsheet or POST JSON — both paths use the same rendering engine, so no-code users and developers get identical output with no format conversion.
How CloviCharts stacks up against per-seat BI and export-based charting on the things developers actually care about.
| Feature | CloviCharts | Tableau | Datawrapper |
|---|---|---|---|
| Pricing model | API-metered | Per-seat, $75+/user/mo | Freemium, $599+/yr teams |
| AI-generated data insights | One-sentence insight per chart | Not available | Not available |
| Server-side rendering API | POST data, get a chart image | Not available | Not available |
| Batch multi-chart generation | 5–10 charts per call | Not available | Not available |
| Setup time | One API call, under 5 min | Days to weeks | Hours, manual export |
| Permanent branded CDN URLs | Stable S3/CloudFront URLs | Not available | Not available |
Comparison based on publicly available plans and features as of 2026. Competitor information may change.
The surfaces your team works in — the render API, the theme builder, and the usage gallery — a real screen from CloviCharts is shown below, alongside interface illustrations.
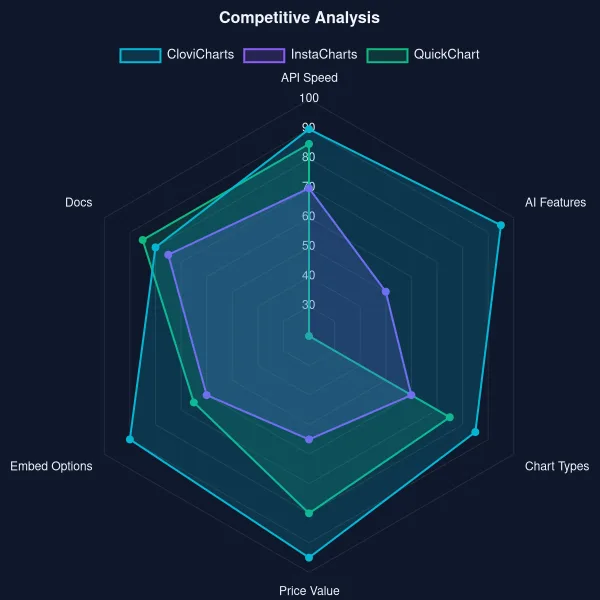
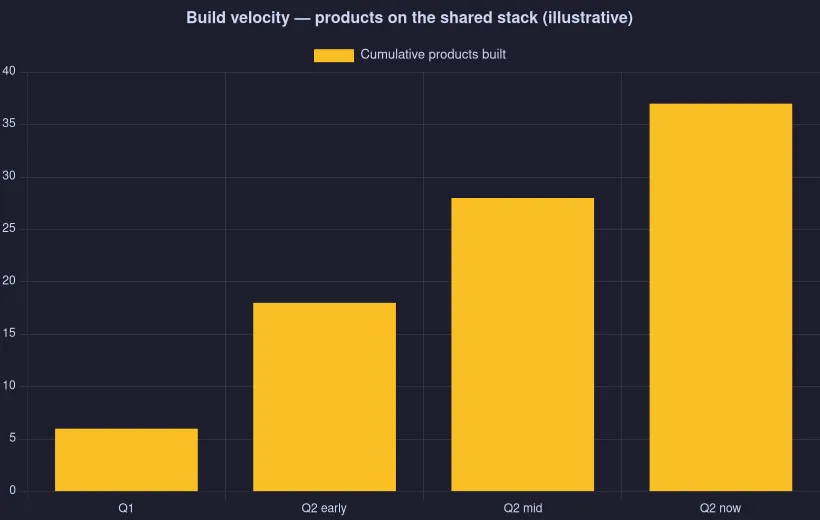
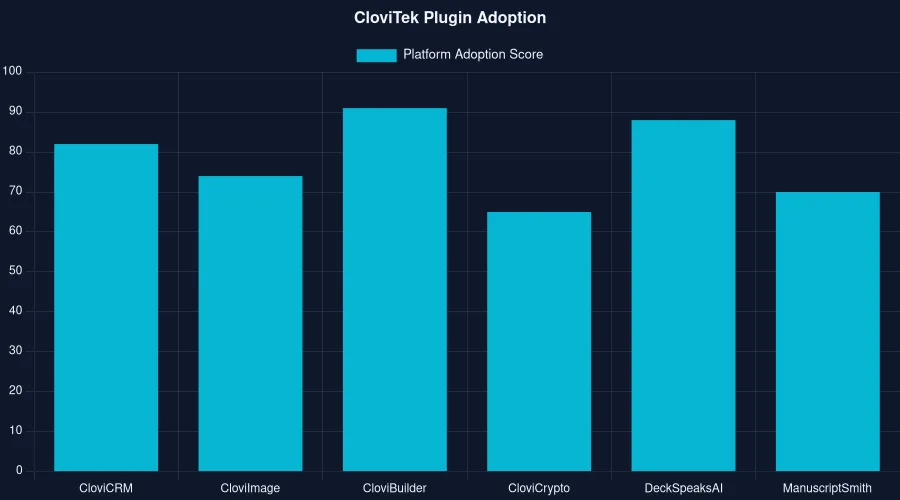
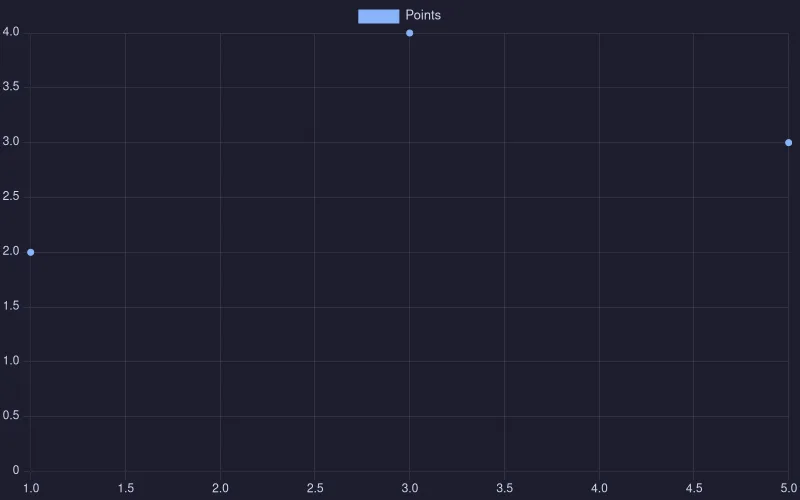
Every chart below is real output rendered by the CloviCharts engine — a span of chart types from bar, line, and donut to radar, waterfall, funnel, candlestick, and heat-calendar. Nothing here is a mockup.
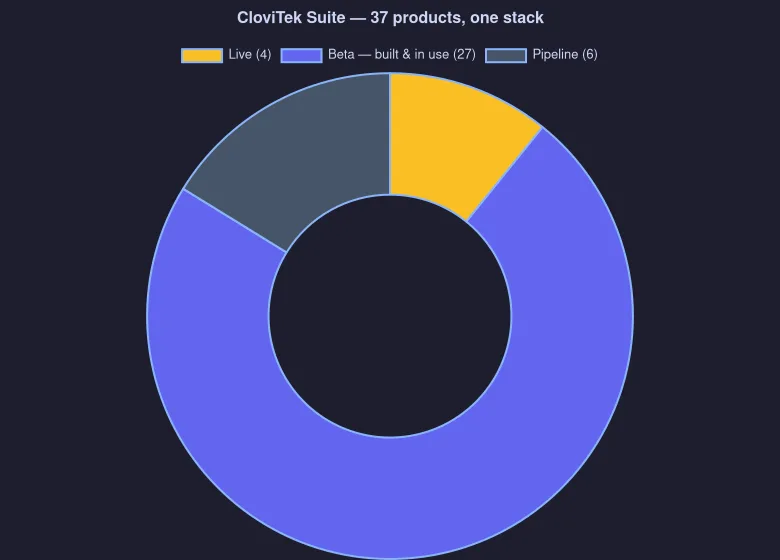
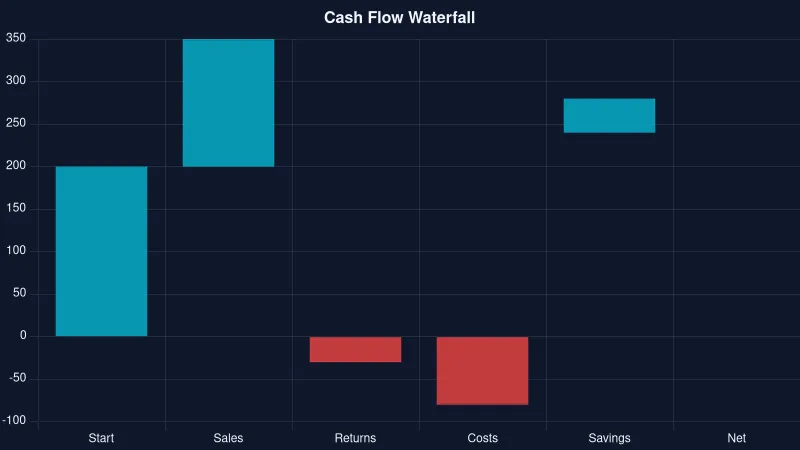
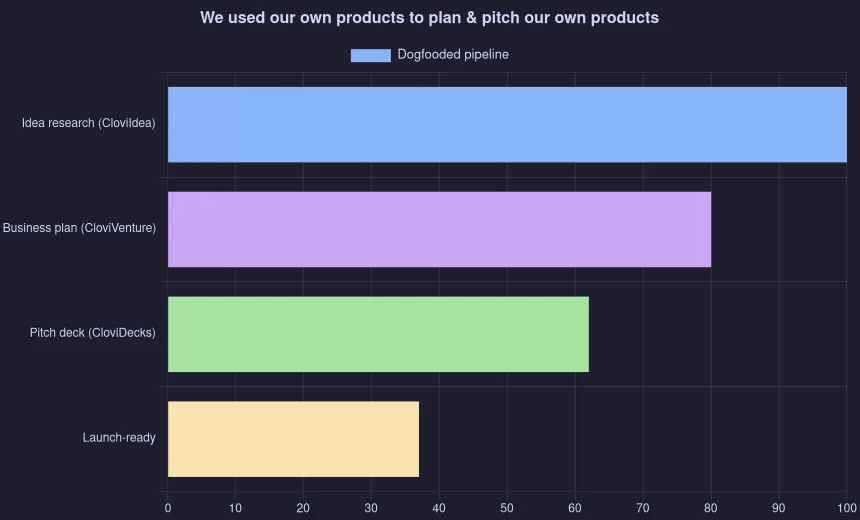
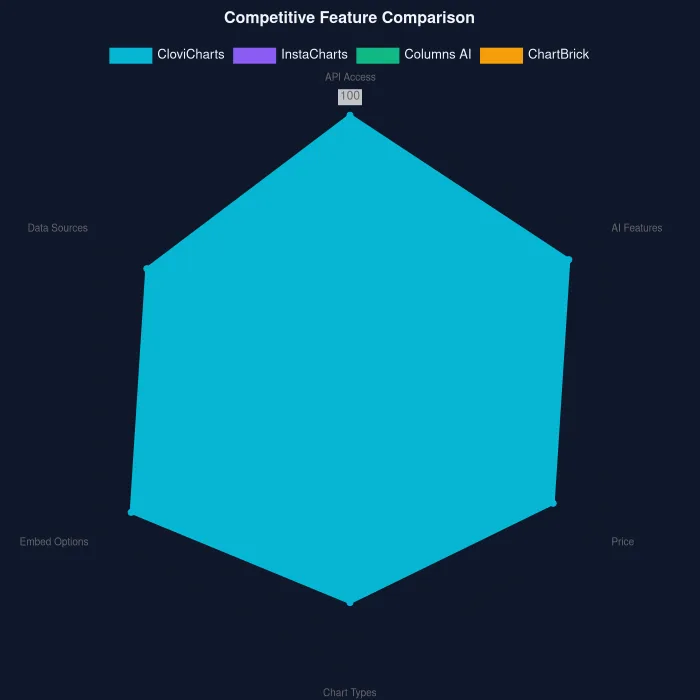

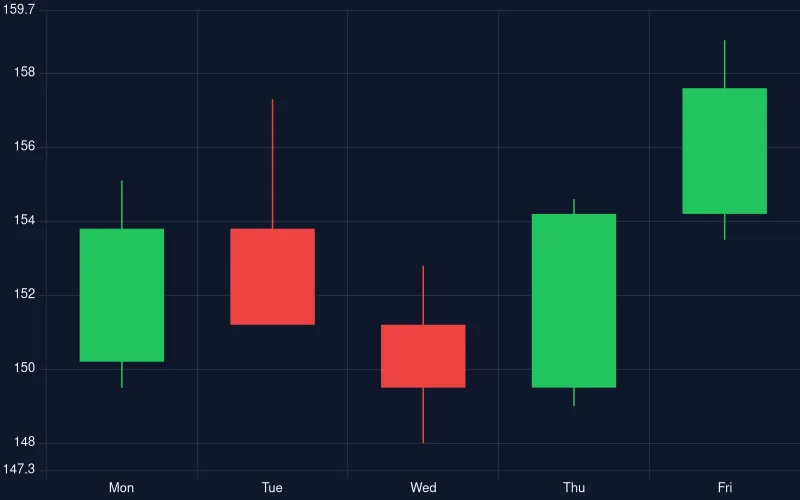
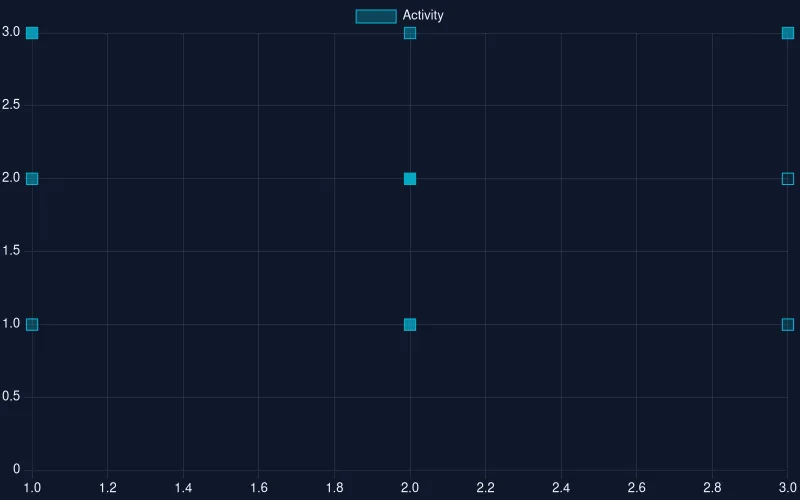
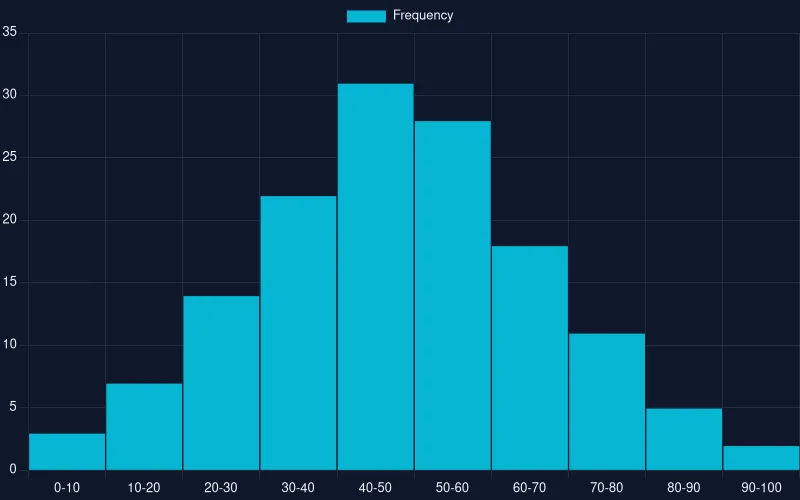
CloviCharts composes shared platform infrastructure and a purpose-built rendering engine — the integrated foundation that makes it faster to ship and stickier to keep.
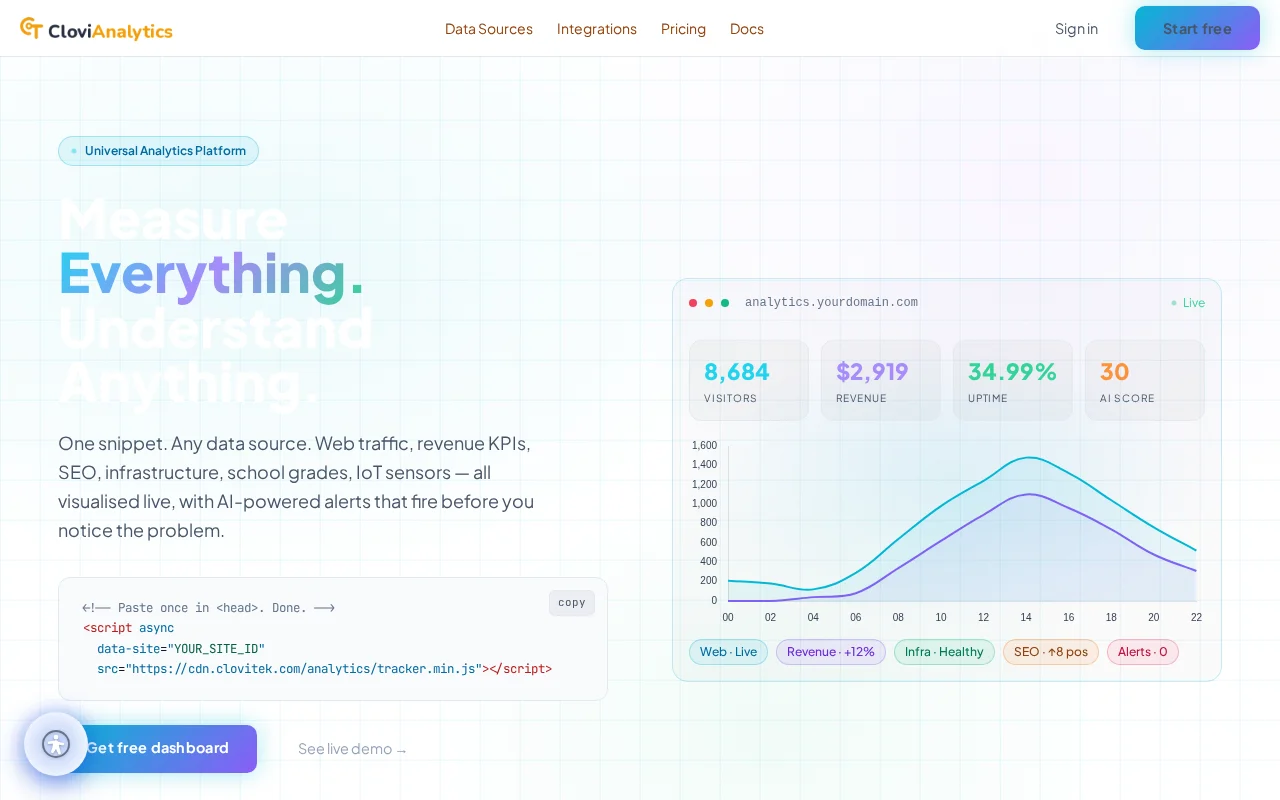
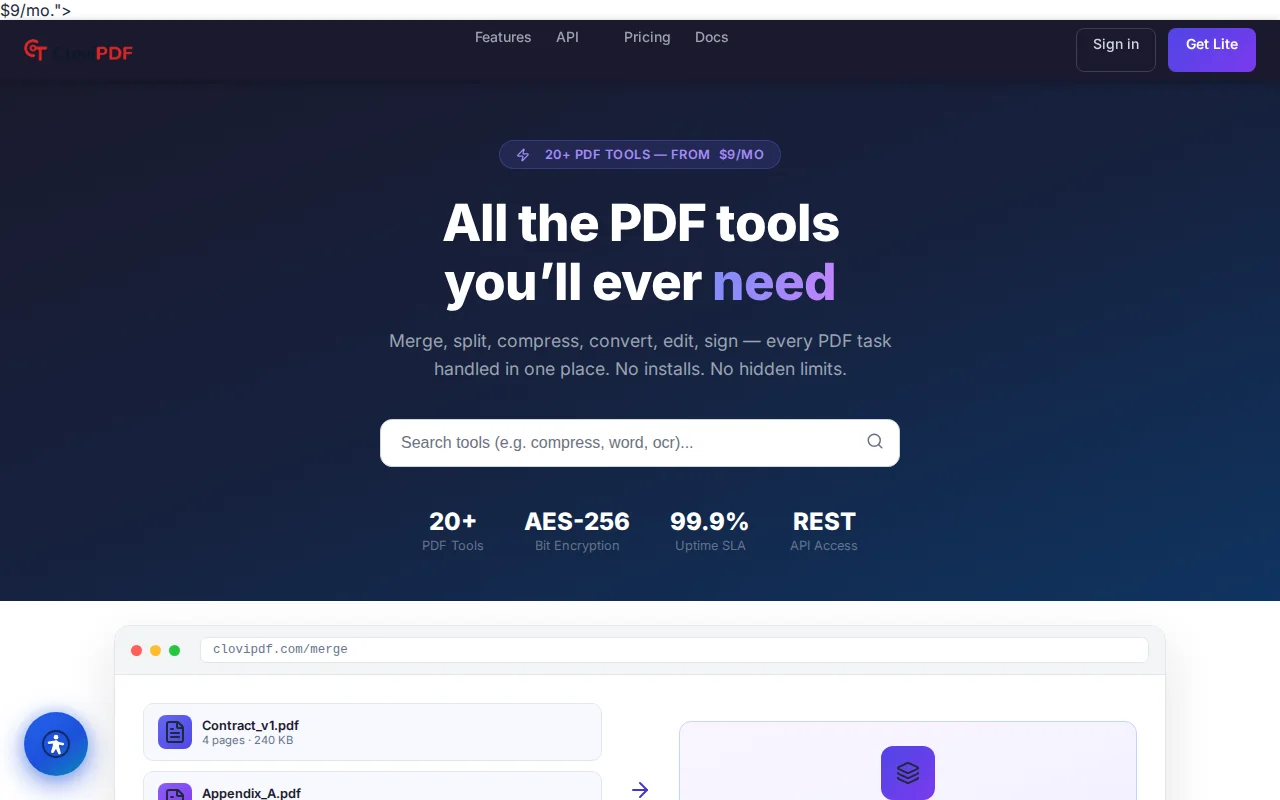
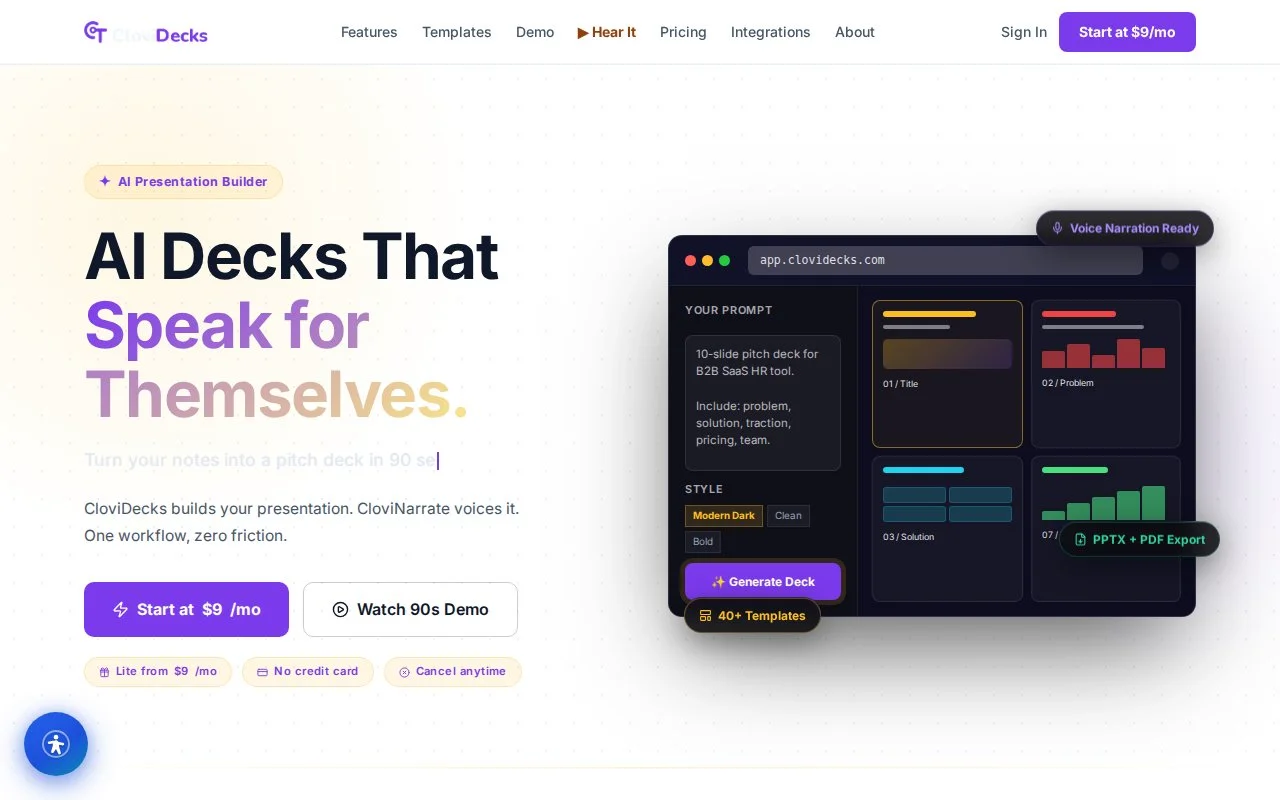
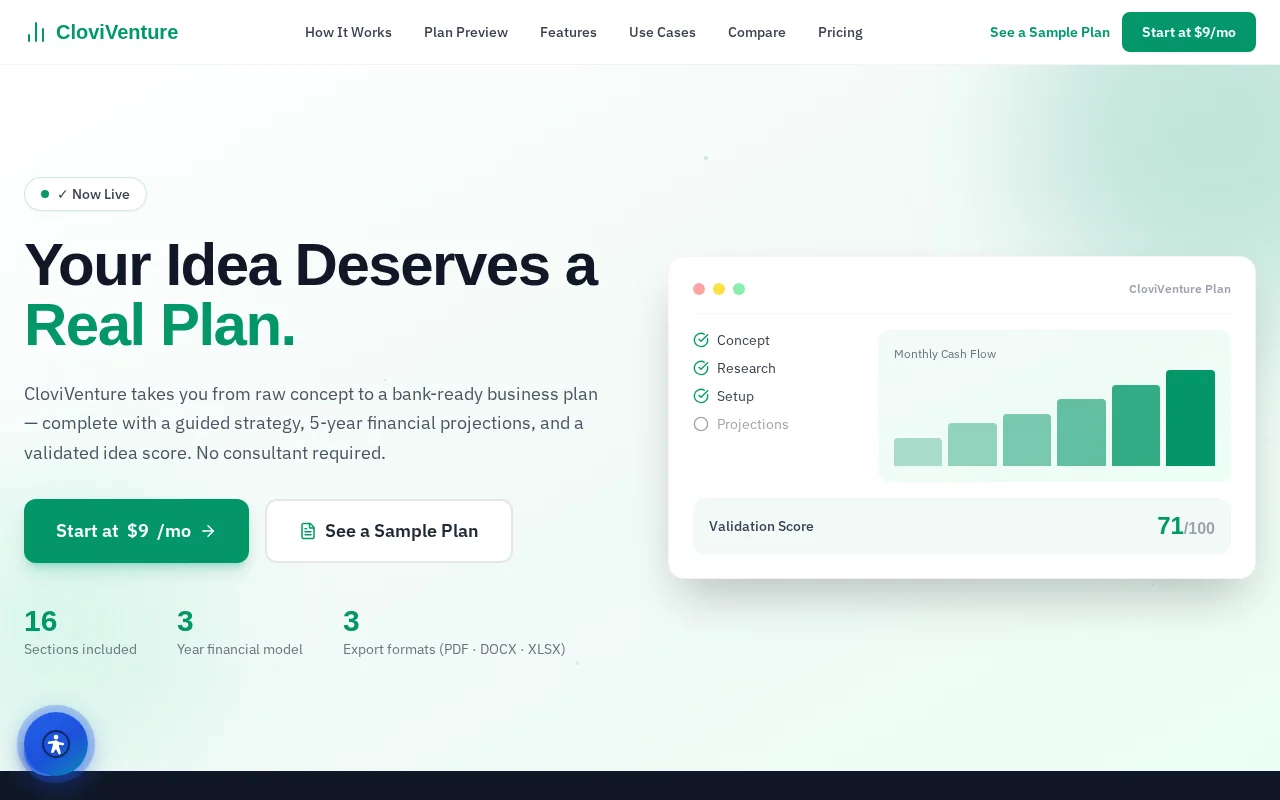
Because CloviCharts is built on the CloviTek platform engine, it inherits shared authentication, billing, and subscription infrastructure on day one — and plugs directly into sibling products in the fleet. It renders charts for CloviPDF reports and CloviDecks slides, takes live metrics from CloviAnalytics, and draws the financial charts inside CloviVenture business plans.
CloviCharts is API-first, so it drops into the tools your team already uses — from the render endpoints to no-code automation and document pipelines.

At a 15-person SaaS startup, maintaining internal tools and a customer dashboard. Frustrated by server-side chart complexity and inconsistent styling — wants a dead-simple POST API and persistent URLs.
Starter / Pro
At a 50-person e-commerce company, running weekly cohort reports and embedding them across channels. Needs consistent branding and automatic AI annotations — no coding required.
Lite / Business
Maintains several separate chart libraries across internal products and wants a single rendering service with audit logs and zero library duplication.
Business / Enterprise
Own reporting features and want to stop bundling a chart library into every service — one API-metered rendering service across the whole product.
Pro / Business
Build branded analytics dashboards for clients and need white-label delivery, per-client themes, and permanent CDN URLs that stay live.
Business / EnterpriseReplace watermarked images with AI-annotated, permanently persistent chart URLs that render on-brand in every email.
Send performance dashboards to your team chat daily or weekly without standing up a full BI platform.
Embed live chart URLs in content pages and databases — charts refresh on schedule without re-exporting from spreadsheets.
Unify chart styling across three or more products by calling one CloviCharts API instead of maintaining separate configs.
Financial reports, cohort analyses, and performance summaries embed charts via stable CDN URLs — ready for CloviPDF.
Pipeline health, engagement, and portfolio performance across CloviTek products — all rendered server-side with zero chart library in each plugin.
CloviCharts ships continuously. Here's what's live today, what's landing next, and where the product is headed.
CloviCharts composes shared platform infrastructure and sibling products — the integrated ecosystem that makes each product faster to build and stickier to keep. Signing up with CloviTek gives you the whole connected system of value, not a single tool.
Live product and revenue analytics
View CloviAnalytics →CloviPDFGenerate branded PDF reports and documents
View CloviPDF →CloviDecksBuild data-rich presentation slides
View CloviDecks →CloviVentureBusiness plans with financial charts
View CloviVenture →CloviCoreShared platform infrastructure
View CloviCore →CloviCharts is proof of what our AI team ships. Tell us what you need built — we compose the same fleet to do it.
Start a project →